Lima, Peru

Naason Milcerio Perez Rojas

Meteorological engineer. Climate risk, remote sensing and automation. I build data systems that turn weather and satellite data into decisions.

Naason Perez Rojas

About

I hold a Bachelor's degree in Meteorological Engineering and Climate Risk Management (UNALM, Peru). I work at the intersection of climate data, geospatial analysis and automation, applied to agricultural risk and parametric insurance.

My profile combines meteorology, GIS, numerical modeling (WRF, HEC-RAS), web development and automation. I am looking to deepen my training in remote sensing and climate risk through a master's program abroad.

Spanish (native) · Quechua (native) · English (intermediate) · Portuguese (intermediate)

Featured projects

Parametric insurance · Coffee (Jaén, San Ignacio)

Professional work · in development

Developed as part of my role at La Positiva Seguros. General description only.

Problem and method
Problem
Identify the critical climate variables that drive loss risk in coffee production in the Jaén and San Ignacio area (Cajamarca), as input for parametric insurance.
Method
Historical analysis with CHIRPS, ERA5 (10 km), Copernicus and SENAMHI data, field trips to validate crop conditions, and Sentinel-2 phenological monitoring.
Result
[Describe at a general level. No client names, amounts or internal screenshots without written permission.]
CHIRPSERA5Sentinel-2PythonGIS

Parametric insurance · Alpaca (Puno)

Professional work · in development

Developed as part of my role at La Positiva Seguros. General description only.

Problem and method
Problem
Identify the critical climate variables that drive loss risk in alpaca herding in Puno, as input for parametric insurance.
Method
Historical analysis with CHIRPS, ERA5 (10 km), Copernicus and SENAMHI data, and field trips to Puno to validate herding conditions.
Result
[Describe at a general level. No client names, amounts or internal screenshots without written permission.]
CHIRPSERA5SENAMHIPythonGIS

Web tool for claims assessment with georeferenced photos

Pilot · in development

Creator. Pilot at La Positiva Seguros. General description only.

Problem and method
Problem
Assessing agricultural claims usually requires sending inspectors to the field.
Method
A web app opened from a link, with no installation: the farmer gives consent and takes georeferenced, watermarked photos, which are sent by email. Coordinates are matched to department, province and district, and cross-checked with risk layers, CHIRPS (95th percentile) and forecasts.
Result
[Pilot stage. State only what has been validated, with no figures or screenshots from real claims.]
JavaScriptCloudflare WorkersDockerGISCHIRPS

Weather warning maps and alerts system

Professional work

Developed at La Positiva Seguros. General description only.

Problem and method
Problem
During critical weather events, official alerts must quickly reach the clients they affect.
Method
A Python service processes SENAMHI warnings, finds the most critical day and generates maps by department. n8n workflows distribute them by WhatsApp, SMS and email. Packaged with Docker.
Result
[Add what can be said publicly. No client data or internal screenshots.]
PythonFlaskGeoPandasPostgreSQLn8nDocker

Precipitation downscaling for Cajamarca (Quantile Mapping)

Course project · completed
Problem and method
Problem
Global climate model precipitation is too coarse and biased to feed regional hydrological models.
Method
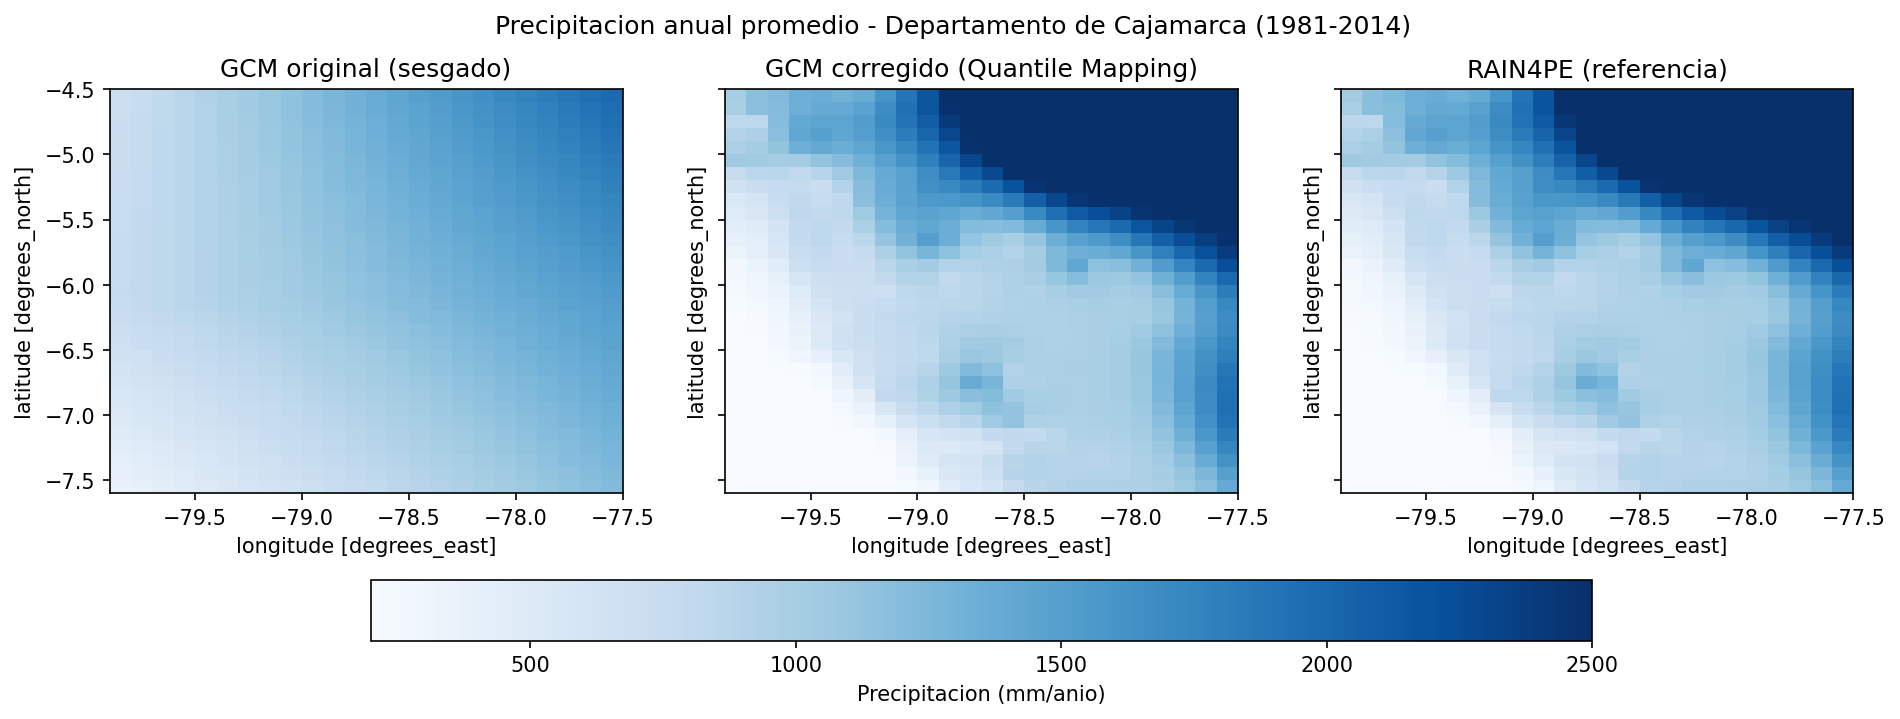
Empirical Quantile Mapping per month and per pixel (100 quantiles). The NorESM2-MM model was interpolated to the 0.1° RAIN4PE grid and calibrated over 1981–2014; the same correction was applied to the SSP5-8.5 scenario.
Result
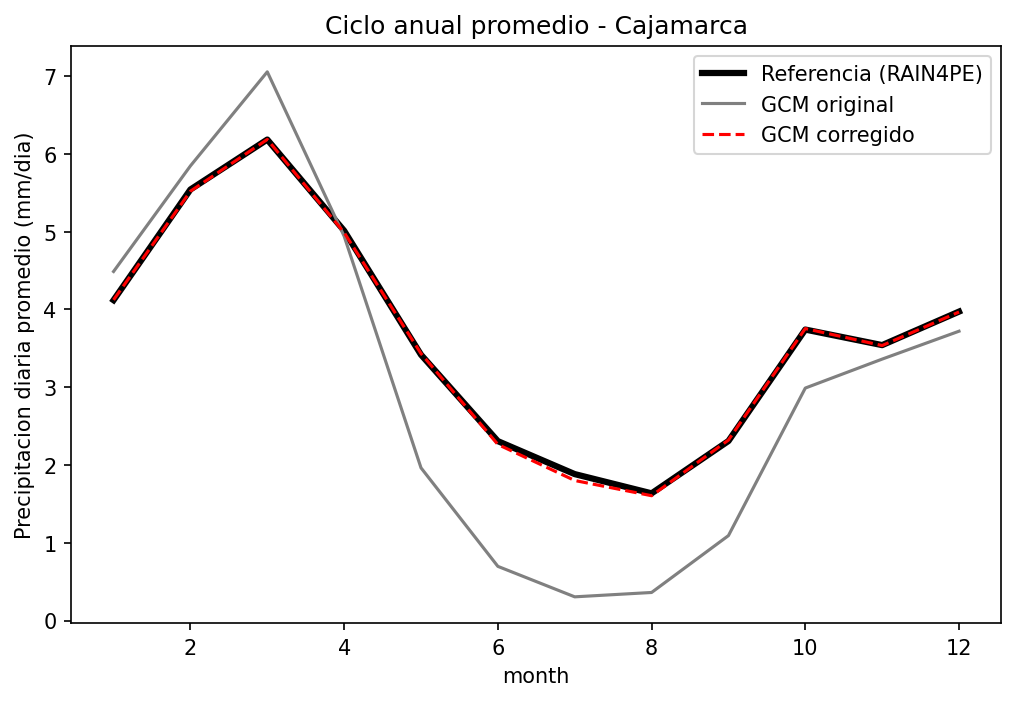
Mean annual precipitation bias against RAIN4PE fell from −14.9% to −0.4%. The 99th percentile of daily rainfall went from 23.1 to 36.1 mm/day (reference: 36.0). Annual-cycle RMSE dropped from 1.00 to 0.03 mm/day. Validation is in-sample; an independent validation period is still needed.
PythonxarrayNumPyRAIN4PECMIP6
Mean annual precipitation over Cajamarca: original model, corrected model and RAIN4PE reference Mean annual cycle of daily precipitation before and after correction

Automated flood-depth maps from HEC-RAS 2D

Course exercise
Problem and method
Problem
HEC-RAS 2D results are hard to read for decisions until they become a clear map.
Method
A Python script reads the HEC-RAS 2D results file, interpolates and smooths maximum depth to a 5 m raster, applies a 0.30 m flood threshold and draws a map with satellite basemap, legend, scale bar and north arrow.
Result
The whole map is produced in a single run from the model output.
HEC-RASPythonh5pySciPyMatplotlib

Regional weather forecasting with WRF

In development · 2026
Problem and method
Problem
Build a regional forecasting chain with a numerical weather model.
Method
WPS and WRF with three nested domains, GFS and ERA5 initial and boundary conditions, download scripts and a Conda environment for pre-processing.
Result
Setup stage, started in the Barlovento WRF courses (2026). No forecasts or validation to show yet.
WRFWPSGFSERA5Linux

INTIUV+ · Smart UV monitoring device

Installed · 2024–2026

Founder and project lead (Inti Smart).

Problem and method
Problem
Exposure to solar UV radiation is a health risk in public spaces, mining and agriculture, and real-time local data is scarce.
Method
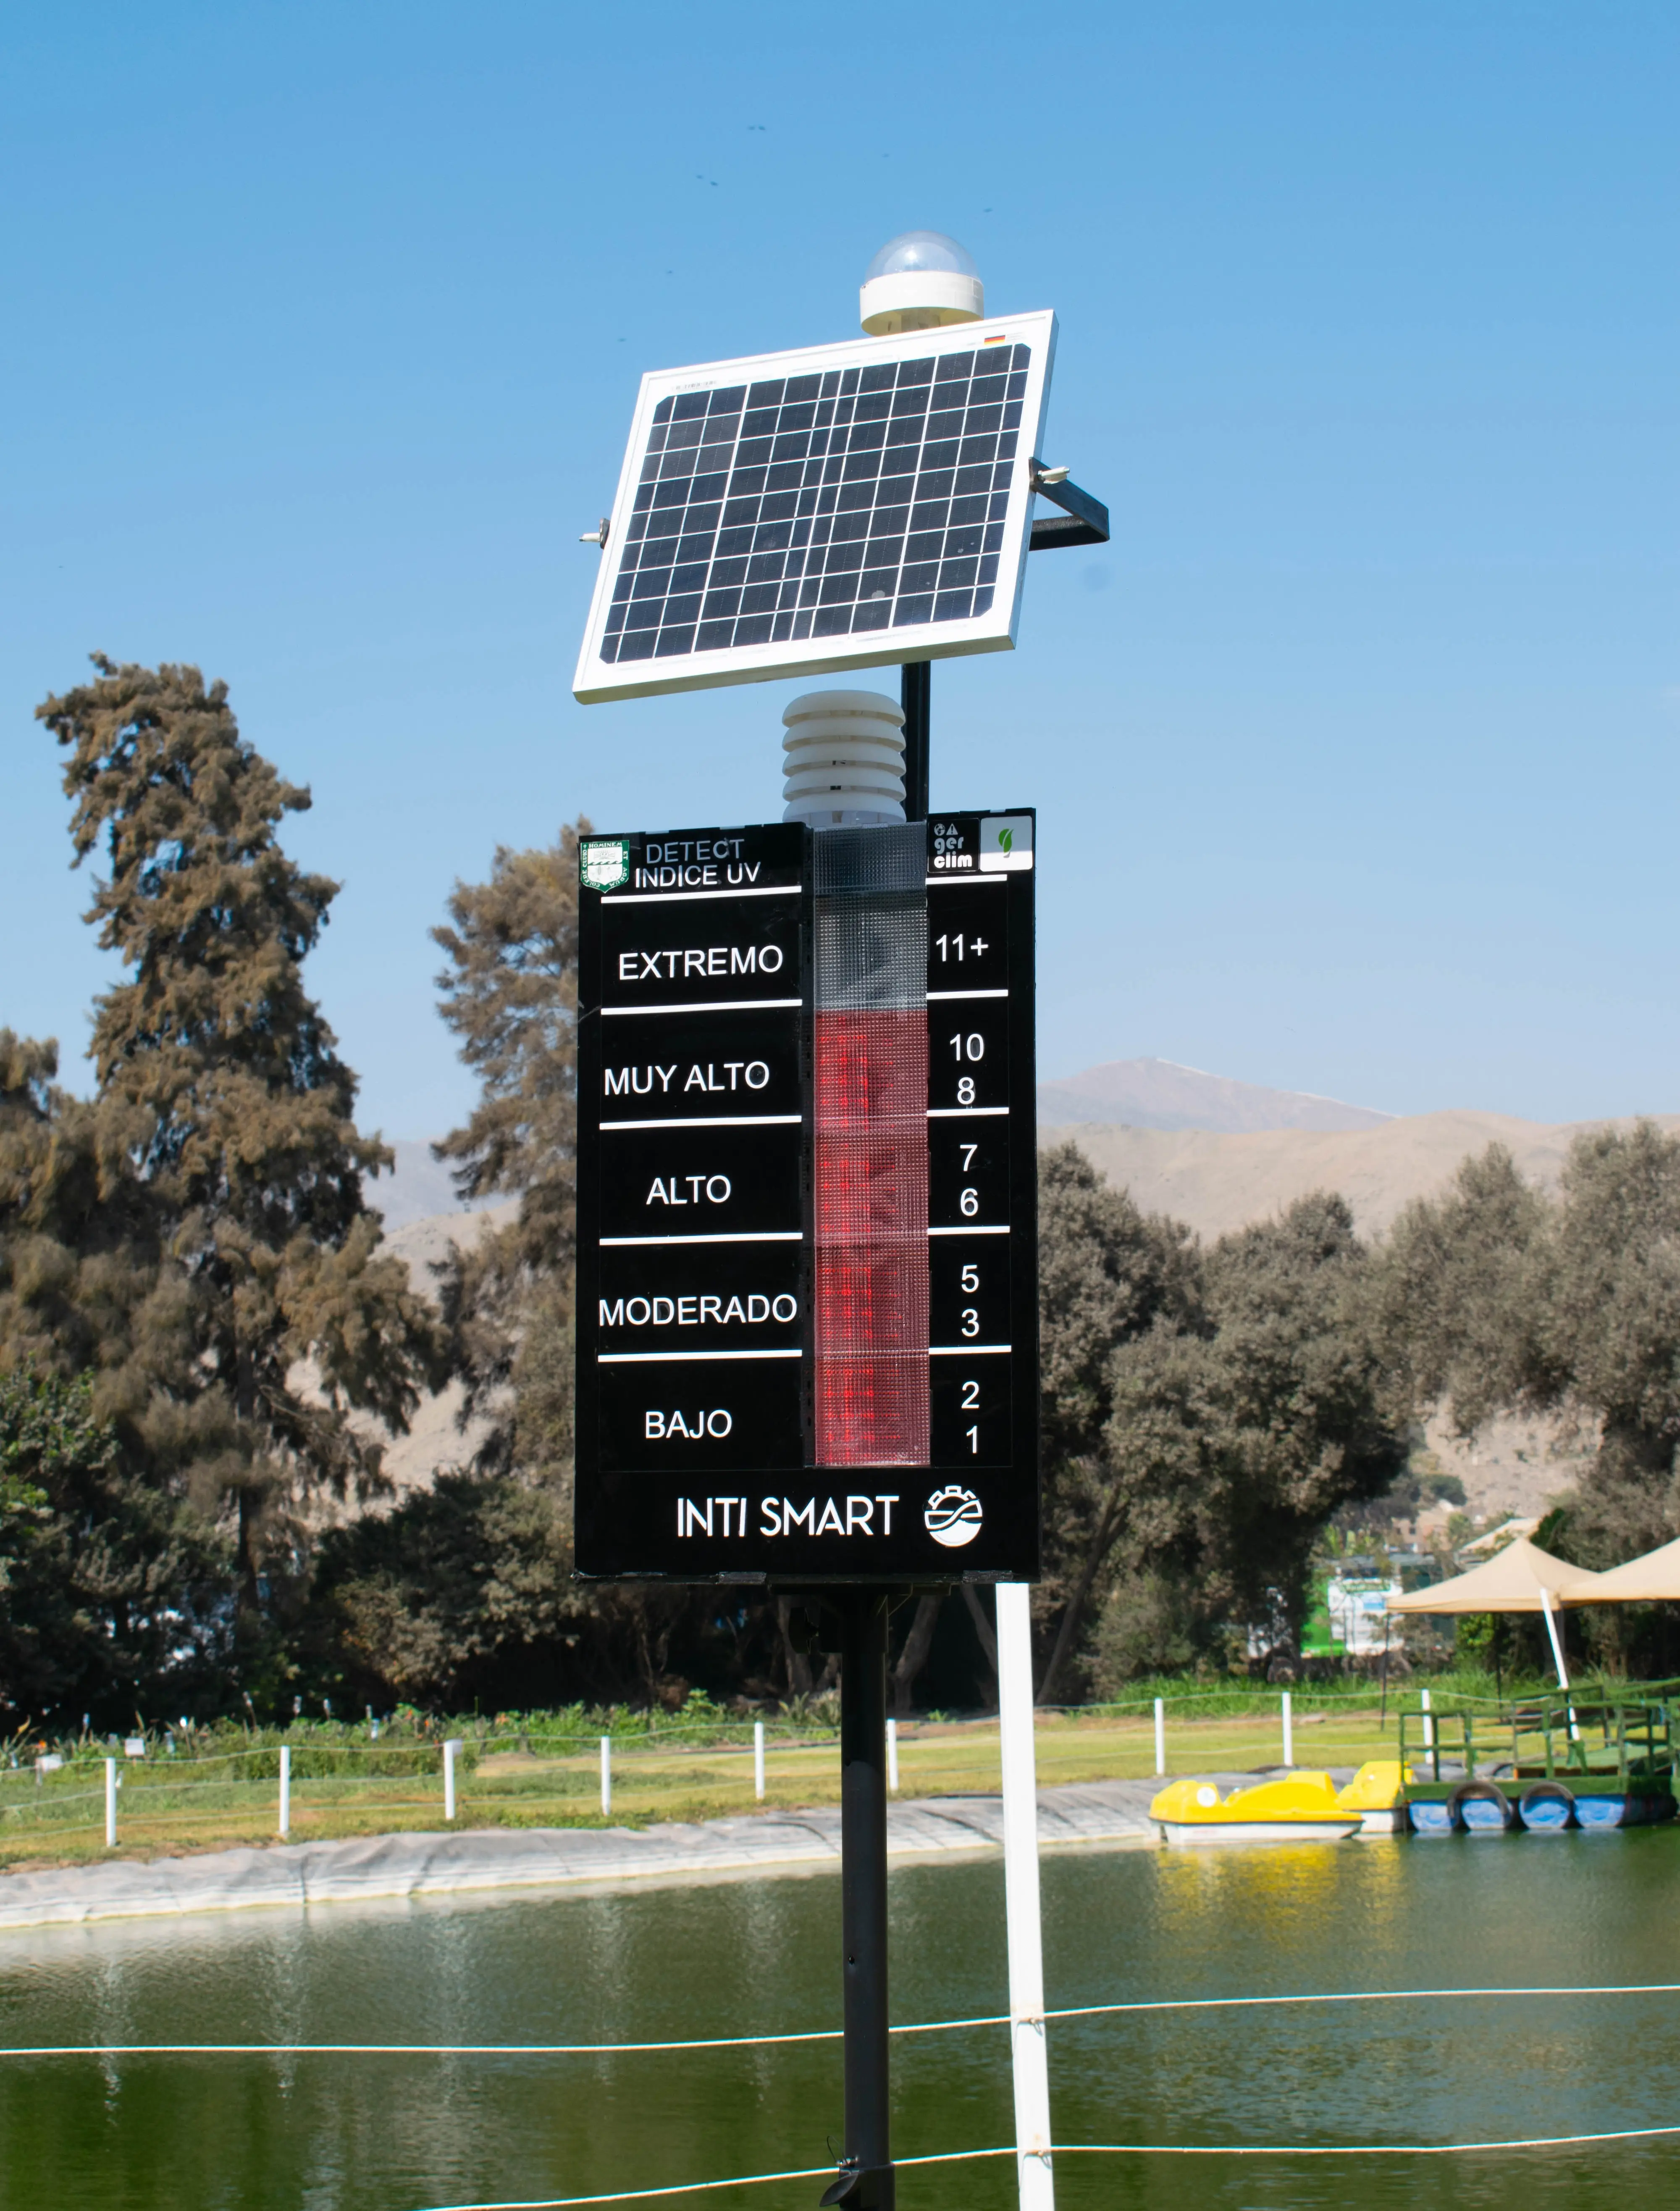
IoT device with sensors and microcontrollers, cloud database and automatic alerts.
Result
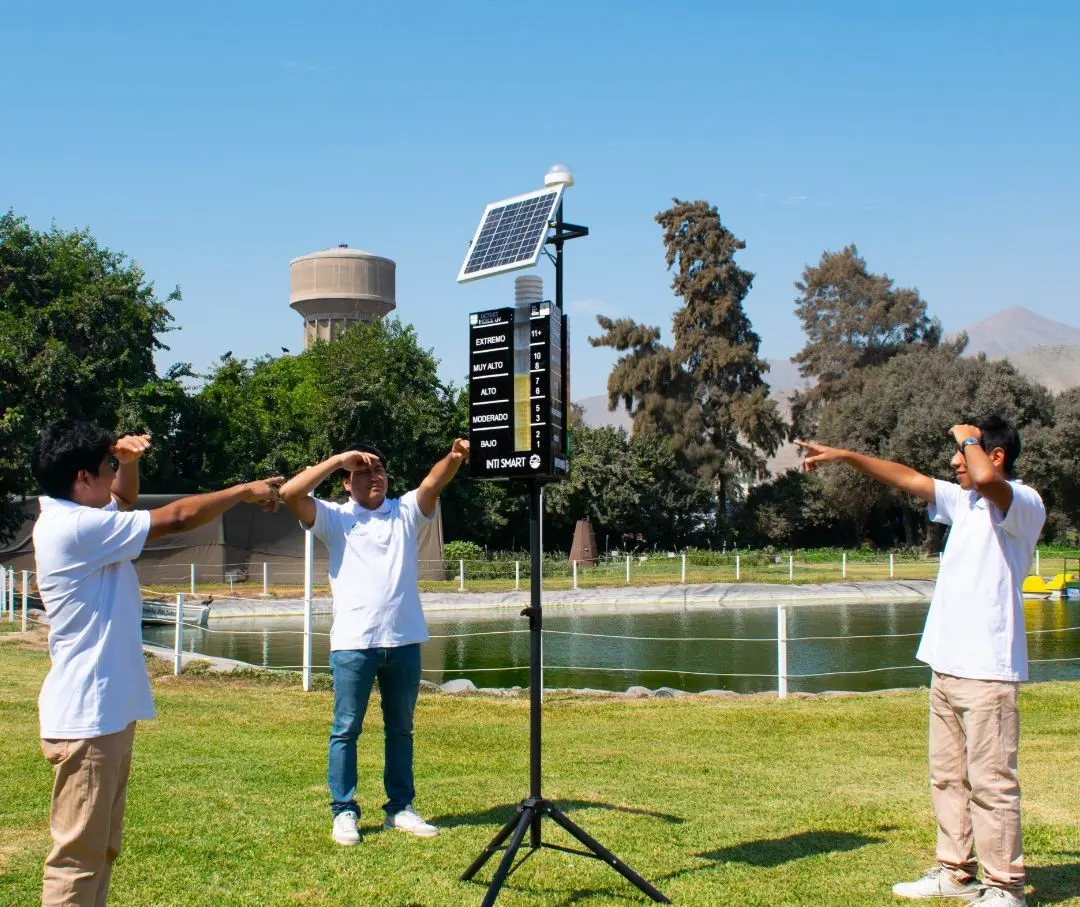
Installed and operating at Universidad Nacional Agraria La Molina (UNALM). Winner of Incubagraria (UNALM). Speaker at the SINAPSIS 2025 International Scientific Congress.
ArduinoPythonSQLAWS/AzurePower BI
Inti Smart team installing the INTIUV+ device at UNALM INTIUV+ device with solar panel and UV index display at UNALM

Other projects

  • Mass-messaging and email automation: WhatsApp and document workflows with Power Automate.
  • Insurance orientation chatbot: WhatsApp chatbot built with n8n.
  • Agroclimatic reports: Tmax, Tmin, precipitation and NDVI from SENAMHI and Sentinel-2/PlanetScope.
  • Sky-image rain warning (in development): Raspberry Pi captures sky images; a Python pipeline and n8n feed an early-warning workflow and a Flutter app.

Experience

  • Rural Insurance Assistant 04/2026 – present

    La Positiva Seguros · Lima, Peru

    • Short- and long-term climate forecast analysis to monitor the Coastal El Niño.
    • Historical climate analysis (CHIRPS, ERA5 at 10 km, Copernicus, SENAMHI) to identify critical risk variables for parametric insurance on coffee (Cajamarca) and alpaca (Puno). (in development)
    • Field trips to Jaén, San Ignacio, Puno and Arequipa to collect climate information and validate crop and camelid-herding conditions. (in development)
    • Web platform for agricultural insurance: enrollments with risk-layer exposure, a viewer of historical accumulations (2013–2026) and a commercial KPI module. (in development)
    • Pilot for claims assessment with georeferenced photos, cross-checked against risk layers, CHIRPS (95th percentile) and forecasts, aiming to reduce the need for field inspectors. (in development)
    • Mass WhatsApp messaging (notices, enrollments, booklets) and file generation with Power Automate.
    • Phenological monitoring with Sentinel-2 to validate insured crops. (in development)
  • Professional Intern 11/2025 – 03/2026

    La Positiva Seguros · Lima, Peru

    • Web weather-warning system: identifies affected clients, generates maps by department and sends alerts by SMS, WhatsApp and email.
    • Automated extraction of information from emails and upload to Google Drive, handling 50–80 notices a day during critical events.
    • Risk maps (floods, landslides) from INGEMMET/GEOCATMIN data to support agricultural and livestock policy decisions.
    • Agroclimatic and livestock reports (Tmax, Tmin, precipitation, NDVI) for mango, olive and avocado crops, using SENAMHI and INGEMMET data.
    • Sentinel-2 and PlanetScope image processing for seasonal vegetation-cover analysis.
    • Web livestock simulator for policy quotes and herd eligibility checks.
  • Environmental Data Analyst (Intern) 02/2025 – 08/2025

    Inti Smart S.A.C. · Lima, Peru

    • Real-time monitoring and processing of environmental variables (UV radiation, temperature, humidity) with Python.
    • SQL database management and Power BI dashboards for environmental indicators.
    • Cloud servers (AWS and Azure) for continuous monitoring systems.
    • n8n workflows for data capture, validation and alert generation.

Skills

Data and programming

PythonSQLRPower BIGit / GitHub

Geospatial and remote sensing

ArcGIS ProQGISGoogle Earth EngineSentinel-2PlanetScope

Climate and modeling

WRFHEC-RASCHIRPSERA5SENAMHI

Automation, cloud and IoT

n8nPower AutomateAWSAzureDockerFlutterArduinoRaspberry Pi

Education and training

  • Bachelor's degree, Meteorological Engineering and Climate Risk Management · UNALM
  • Modeling and applied meteorology: HEC-RAS with Python for flow studies (06/2026) · WRF Basic, Barlovento (07/2026) · temperature and humidity downscaling at 1 km (08/2026) · WRF Intermediate, Barlovento (09/2026)
  • Remote sensing and GIS: AI for satellite image classification, CIGLAS (2025) · GIS for risk management, UNALM (2023) · ArcGIS Basic to Advanced, UNALM (2022) · image processing with R, CIECI (2022) · Disaster risk management, Capacítate Perú (2023)
  • Data: Python for environmental data, Inti Smart (2025) · Power BI Data Analyst (2025) · SQL Server Fundamentals and Advanced (2025) · Python Basic to Advanced, UNALM (2022) · Excel Basic to Advanced (2023)
  • Automation and cloud: n8n workflows · Git + GitHub · AWS Cloud Practitioner · Power Automate · IoT Data Analytics (2025)